How It Works

See exactly how every bill is priced. From start to finish.

FOR PAYERS

Use pricing visibility to stop overpayments

1 IDENTIFY RISK

Catch overpayments before payment

Bills are automatically ranked by potential overpayment, so your team focuses on the highest-impact items first.

💡 $26,000 potential overpayment. Review before payment
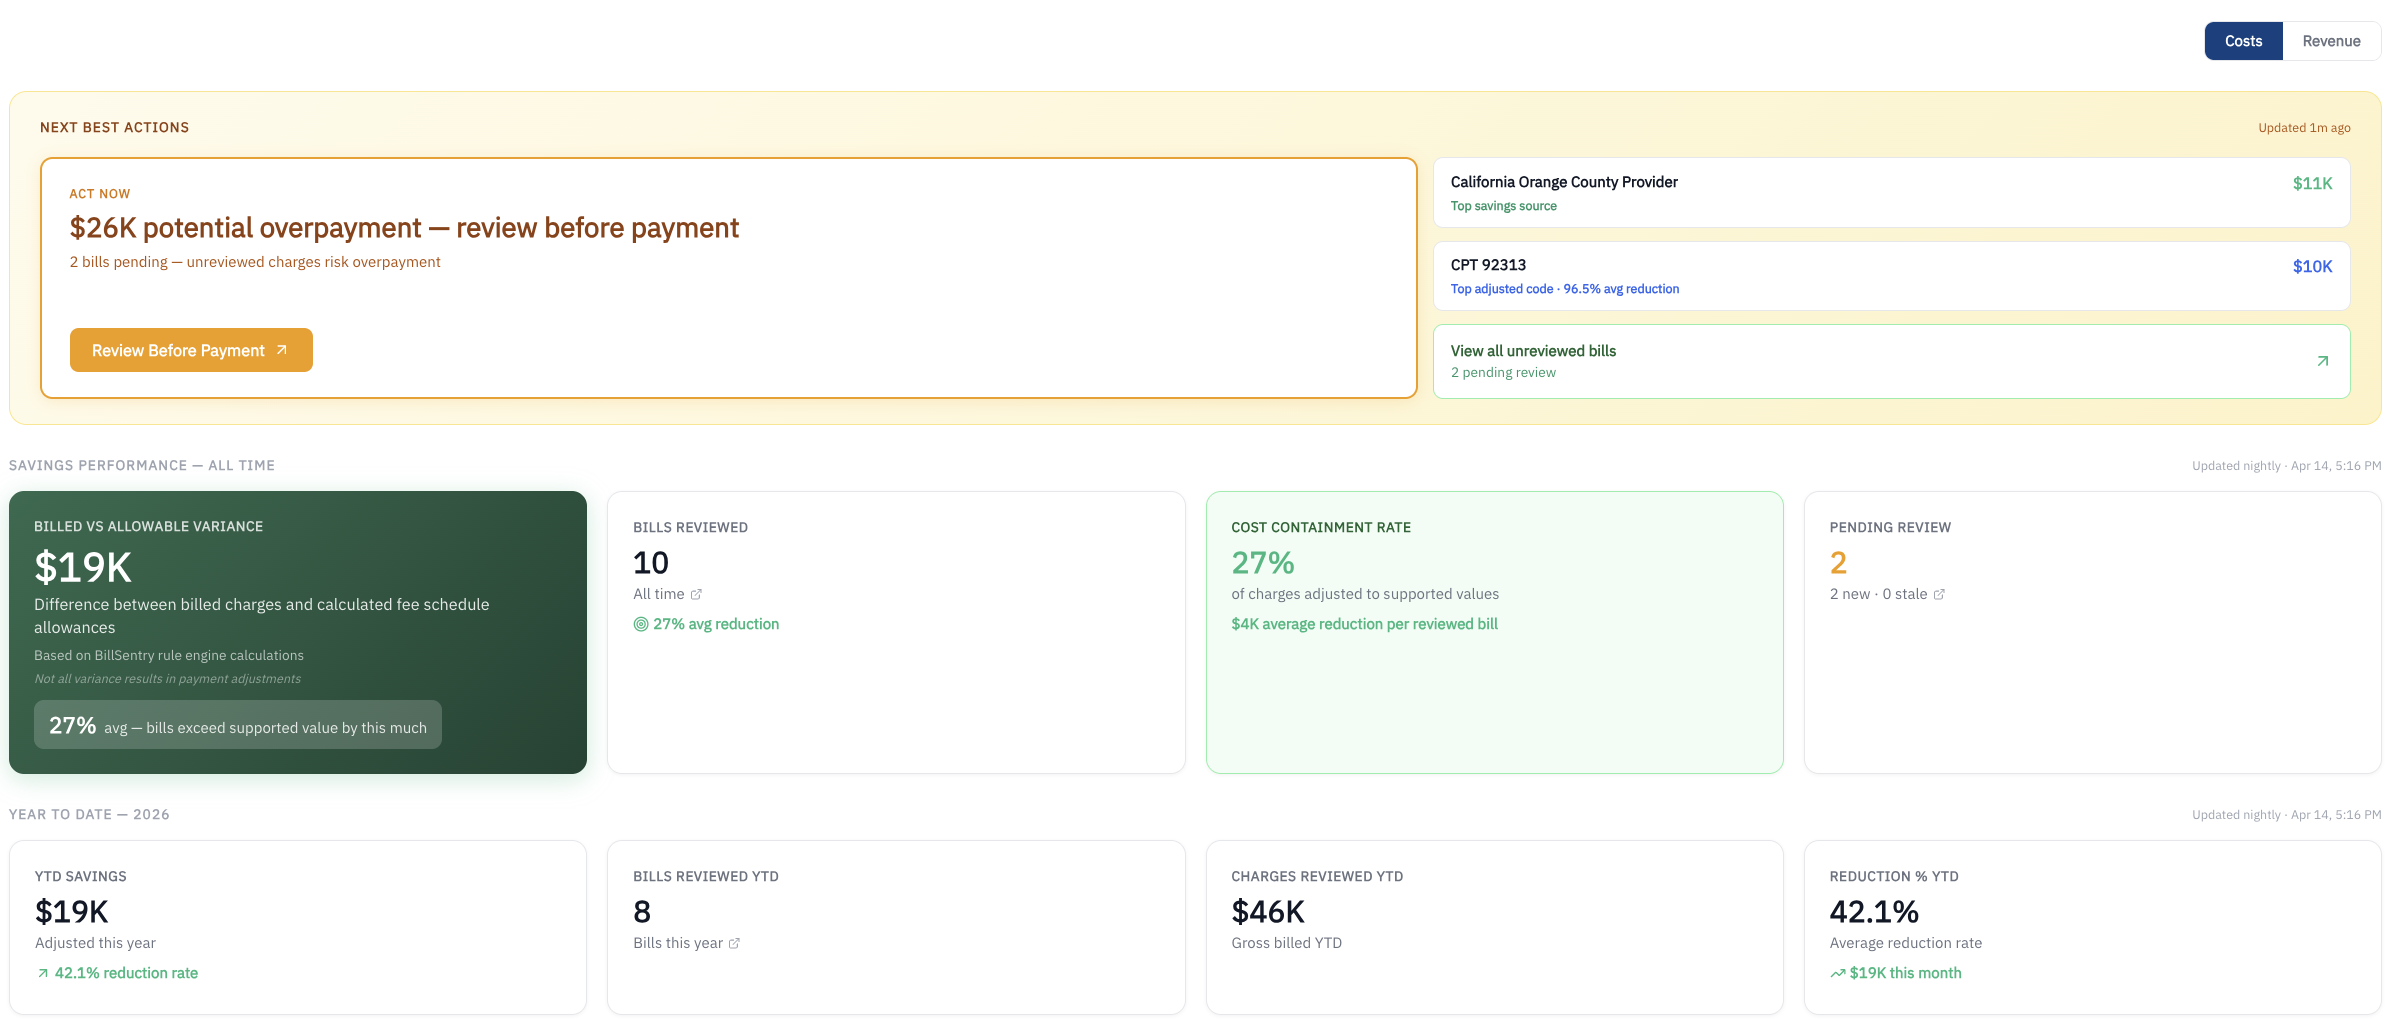
Payer dashboard showing actionable work queue ranked by potential overpayment
⊕ Click to expand
Once flagged, you can immediately break down the financial impact.
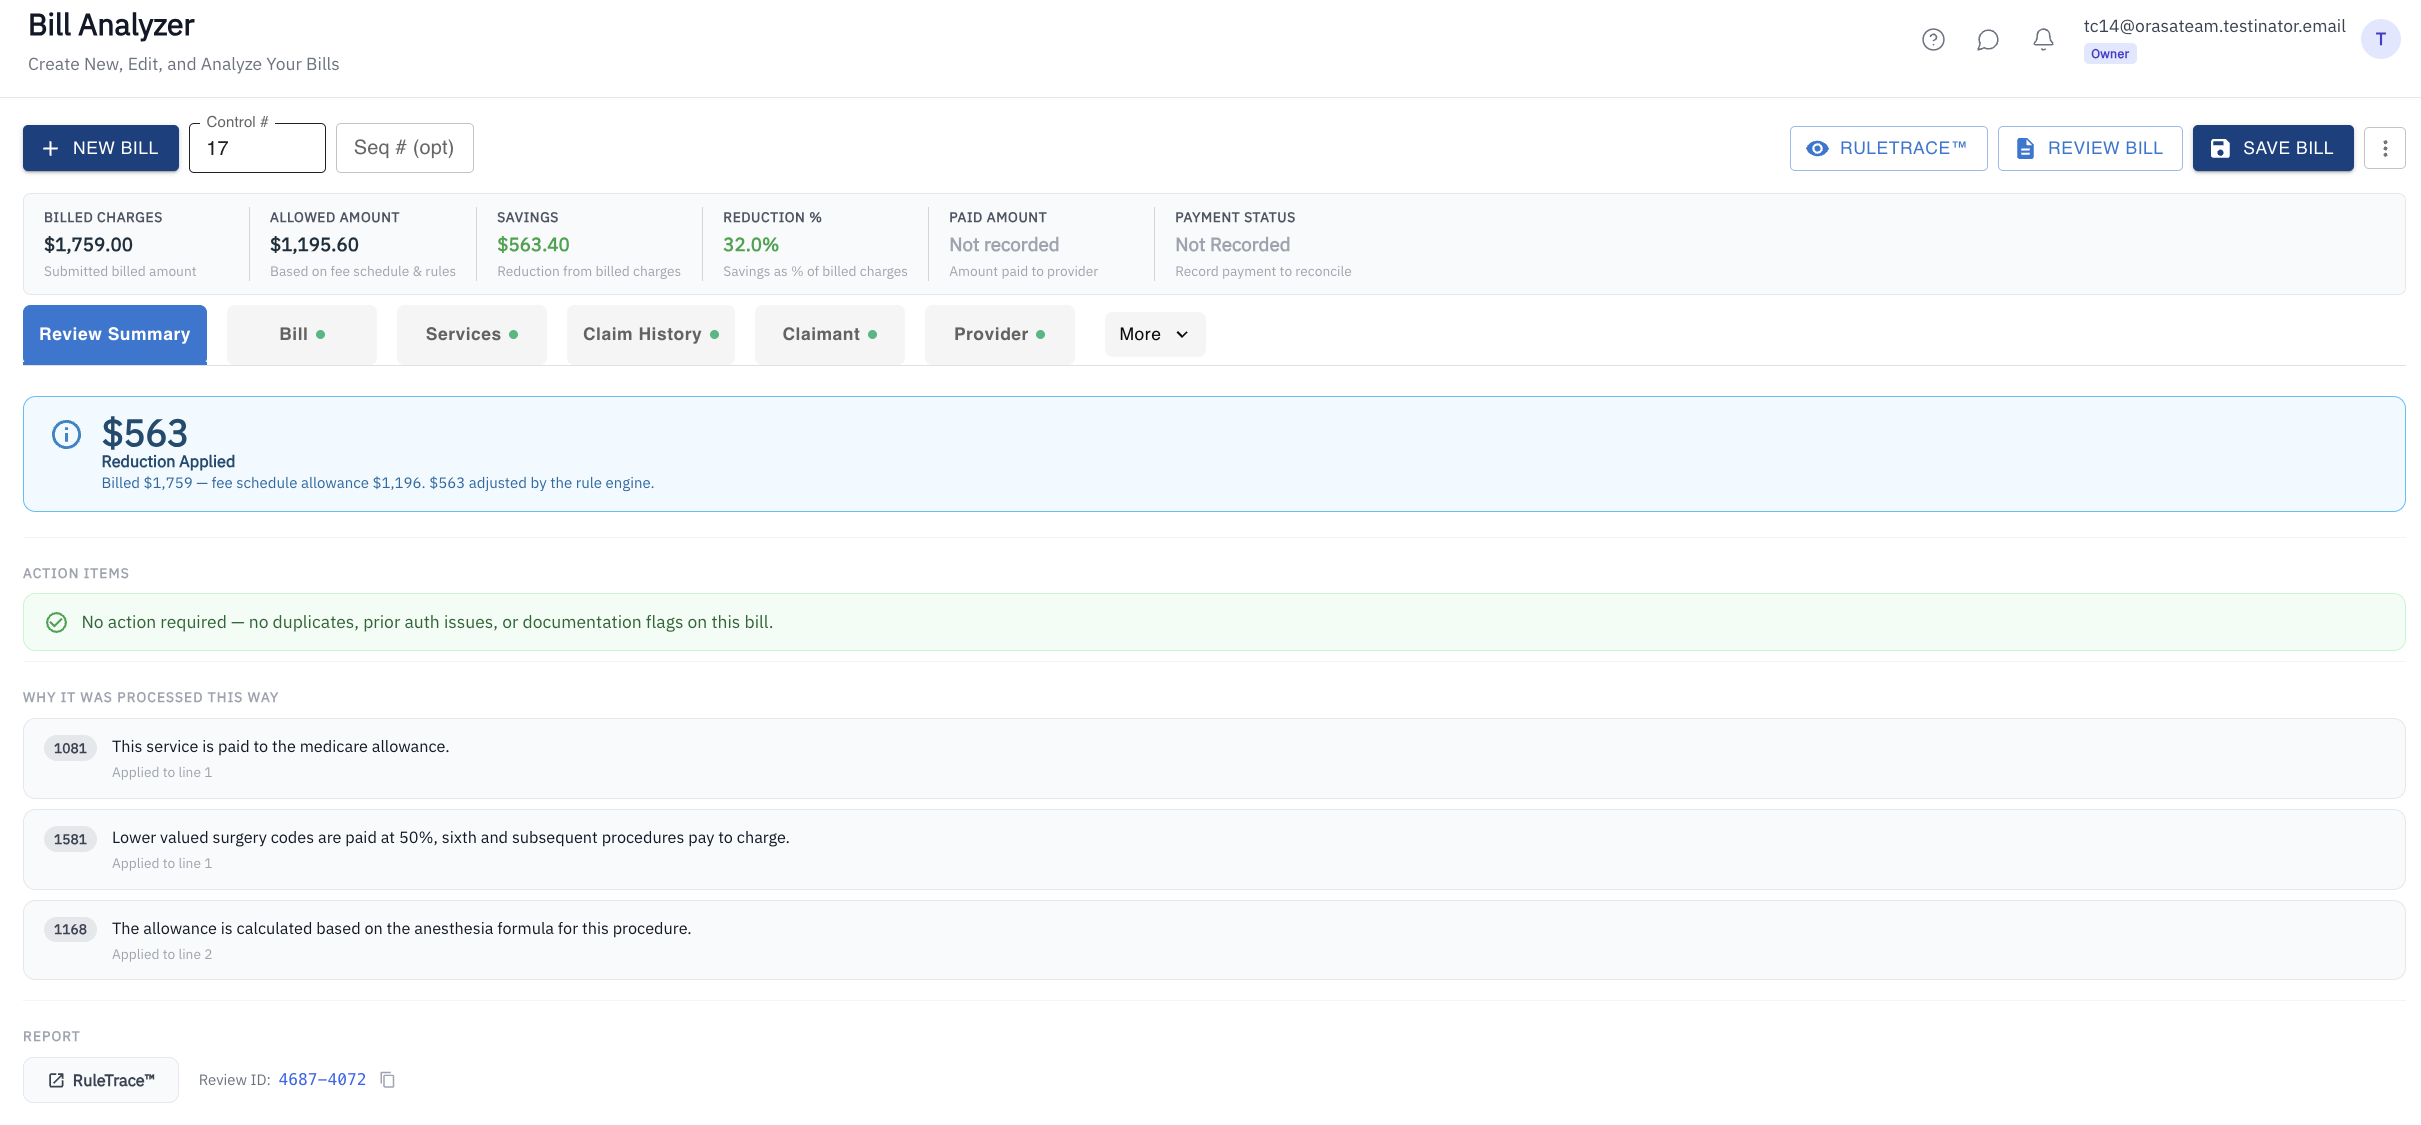
Payer Review Summary showing billed vs allowed amount and savings
⊕ Click to expand
2 QUANTIFY THE IMPACT

See exactly where you’re overpaying, and the total impact

The Review Summary shows what was billed, what’s supported, and exactly how much can be adjusted, instantly.

💡 $1,759 billed → $1,196 allowed → $563 savings
Learn more about Workers’ Compensation Payment Integrity →
From there, drill into each line to see exactly how the decision was made.
3 RULETRACE™ BREAKDOWN

See the exact rule and calculation behind every adjustment

RuleTrace™ shows the calculation steps, applicable rules, and regulatory source for each service line, all from the same screen.

💡 Second procedure reduced to 50%. CA fee schedule §9789.16.5
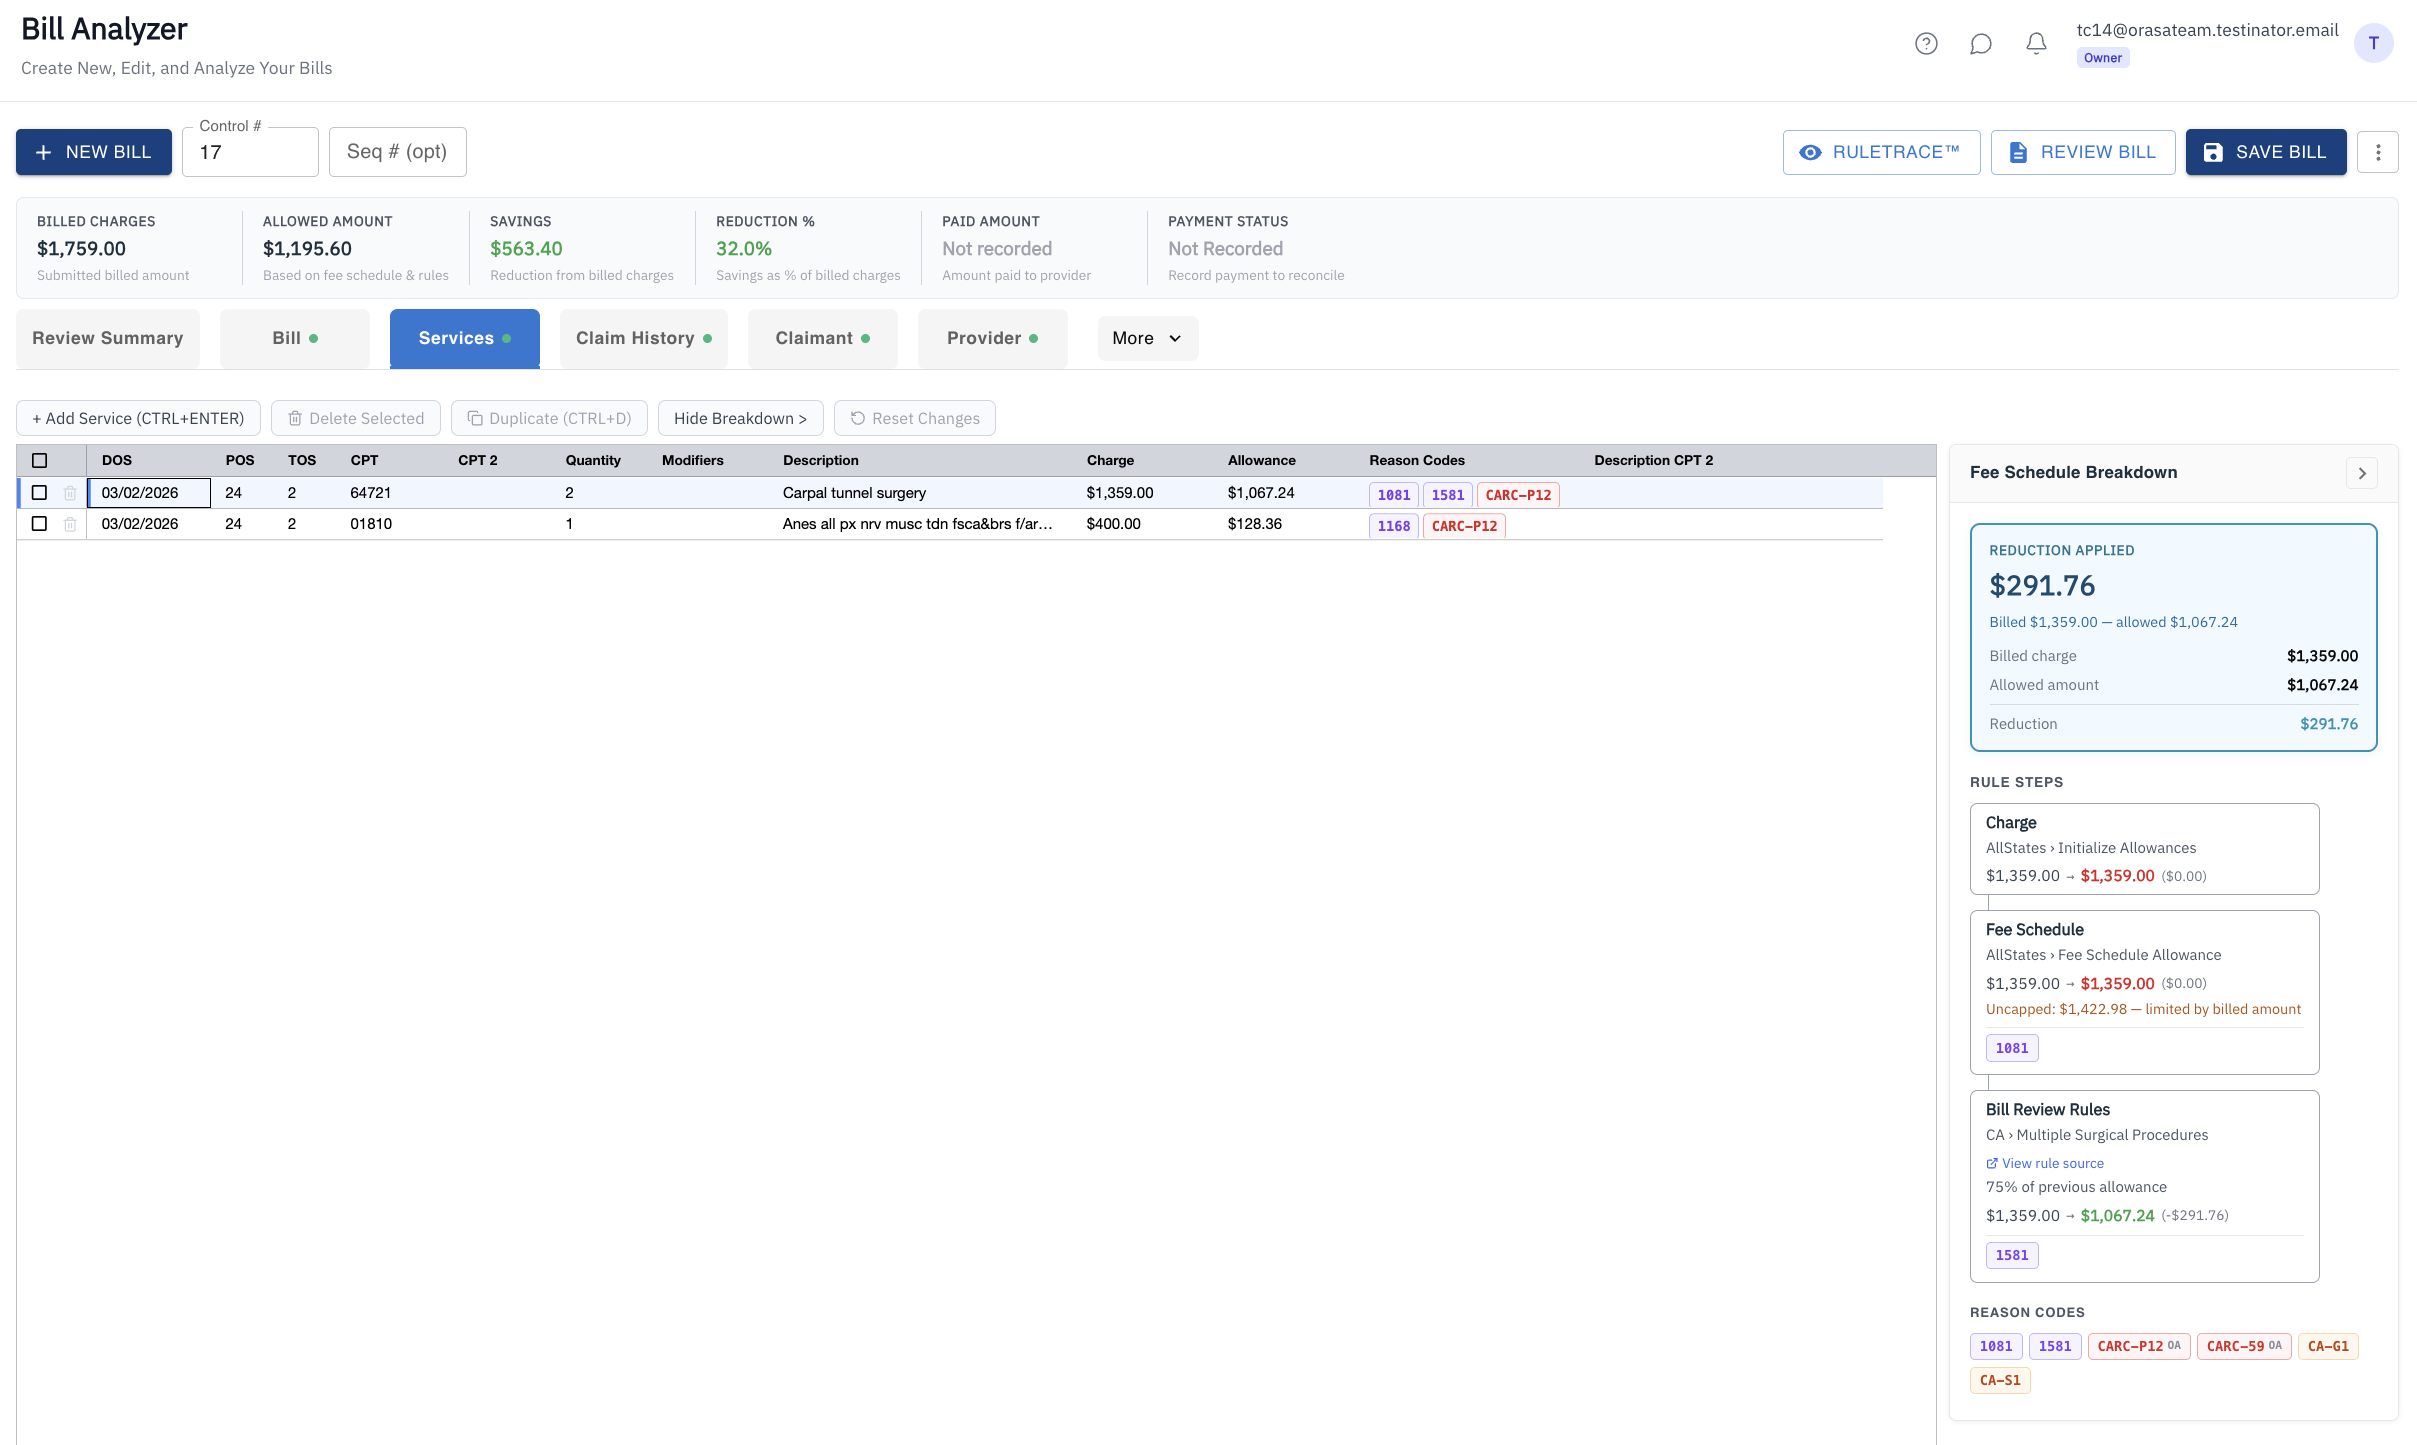
Payer service line breakdown showing charge, allowance, and gap for each CPT code
⊕ Click to expand
And every decision is backed by the exact regulatory source.
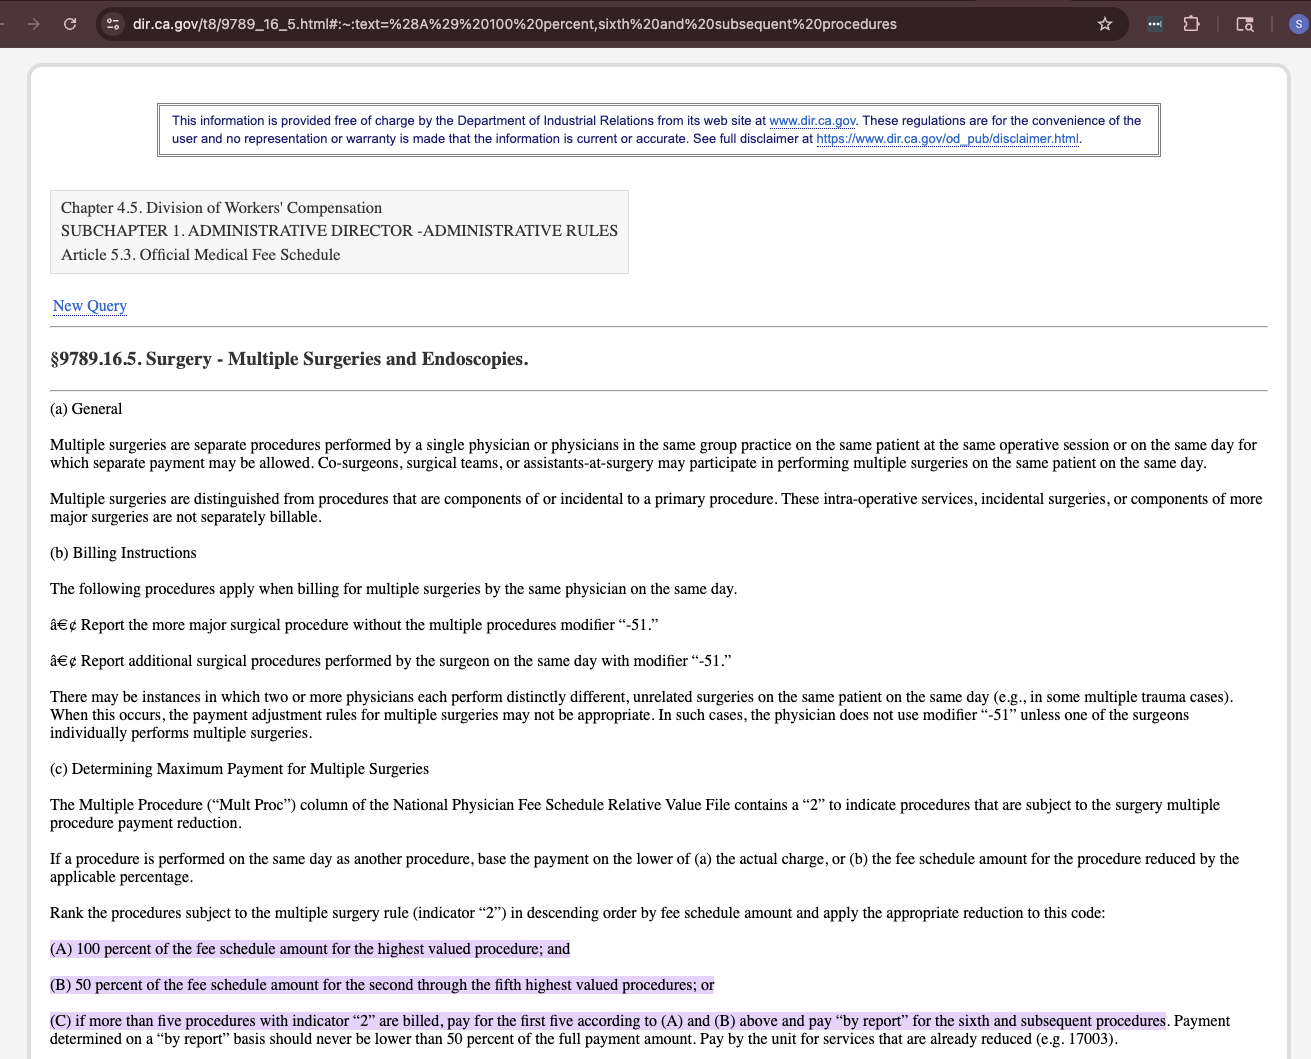
Regulatory source document open on state website with applicable fee schedule rule highlighted
⊕ Click to expand
4 RULETRACE™ SOURCE

Open the exact regulation behind every decision, with the relevant section highlighted

Every RuleTrace™ adjustment links directly to the official regulatory source, with the relevant section highlighted, so every decision is fully defensible.

💡 Official source opened with §9789.16.5 highlighted

Share the RuleTrace™, put the ID or QR on your EOR, or embed it in your workflow.

See a live RuleTrace™ →
FOR PROVIDERS, RCM & MEDICAL BILLING

Identify and recover missed revenue

1 UNDERBILLING DETECTED

Identify where you’re being underpaid

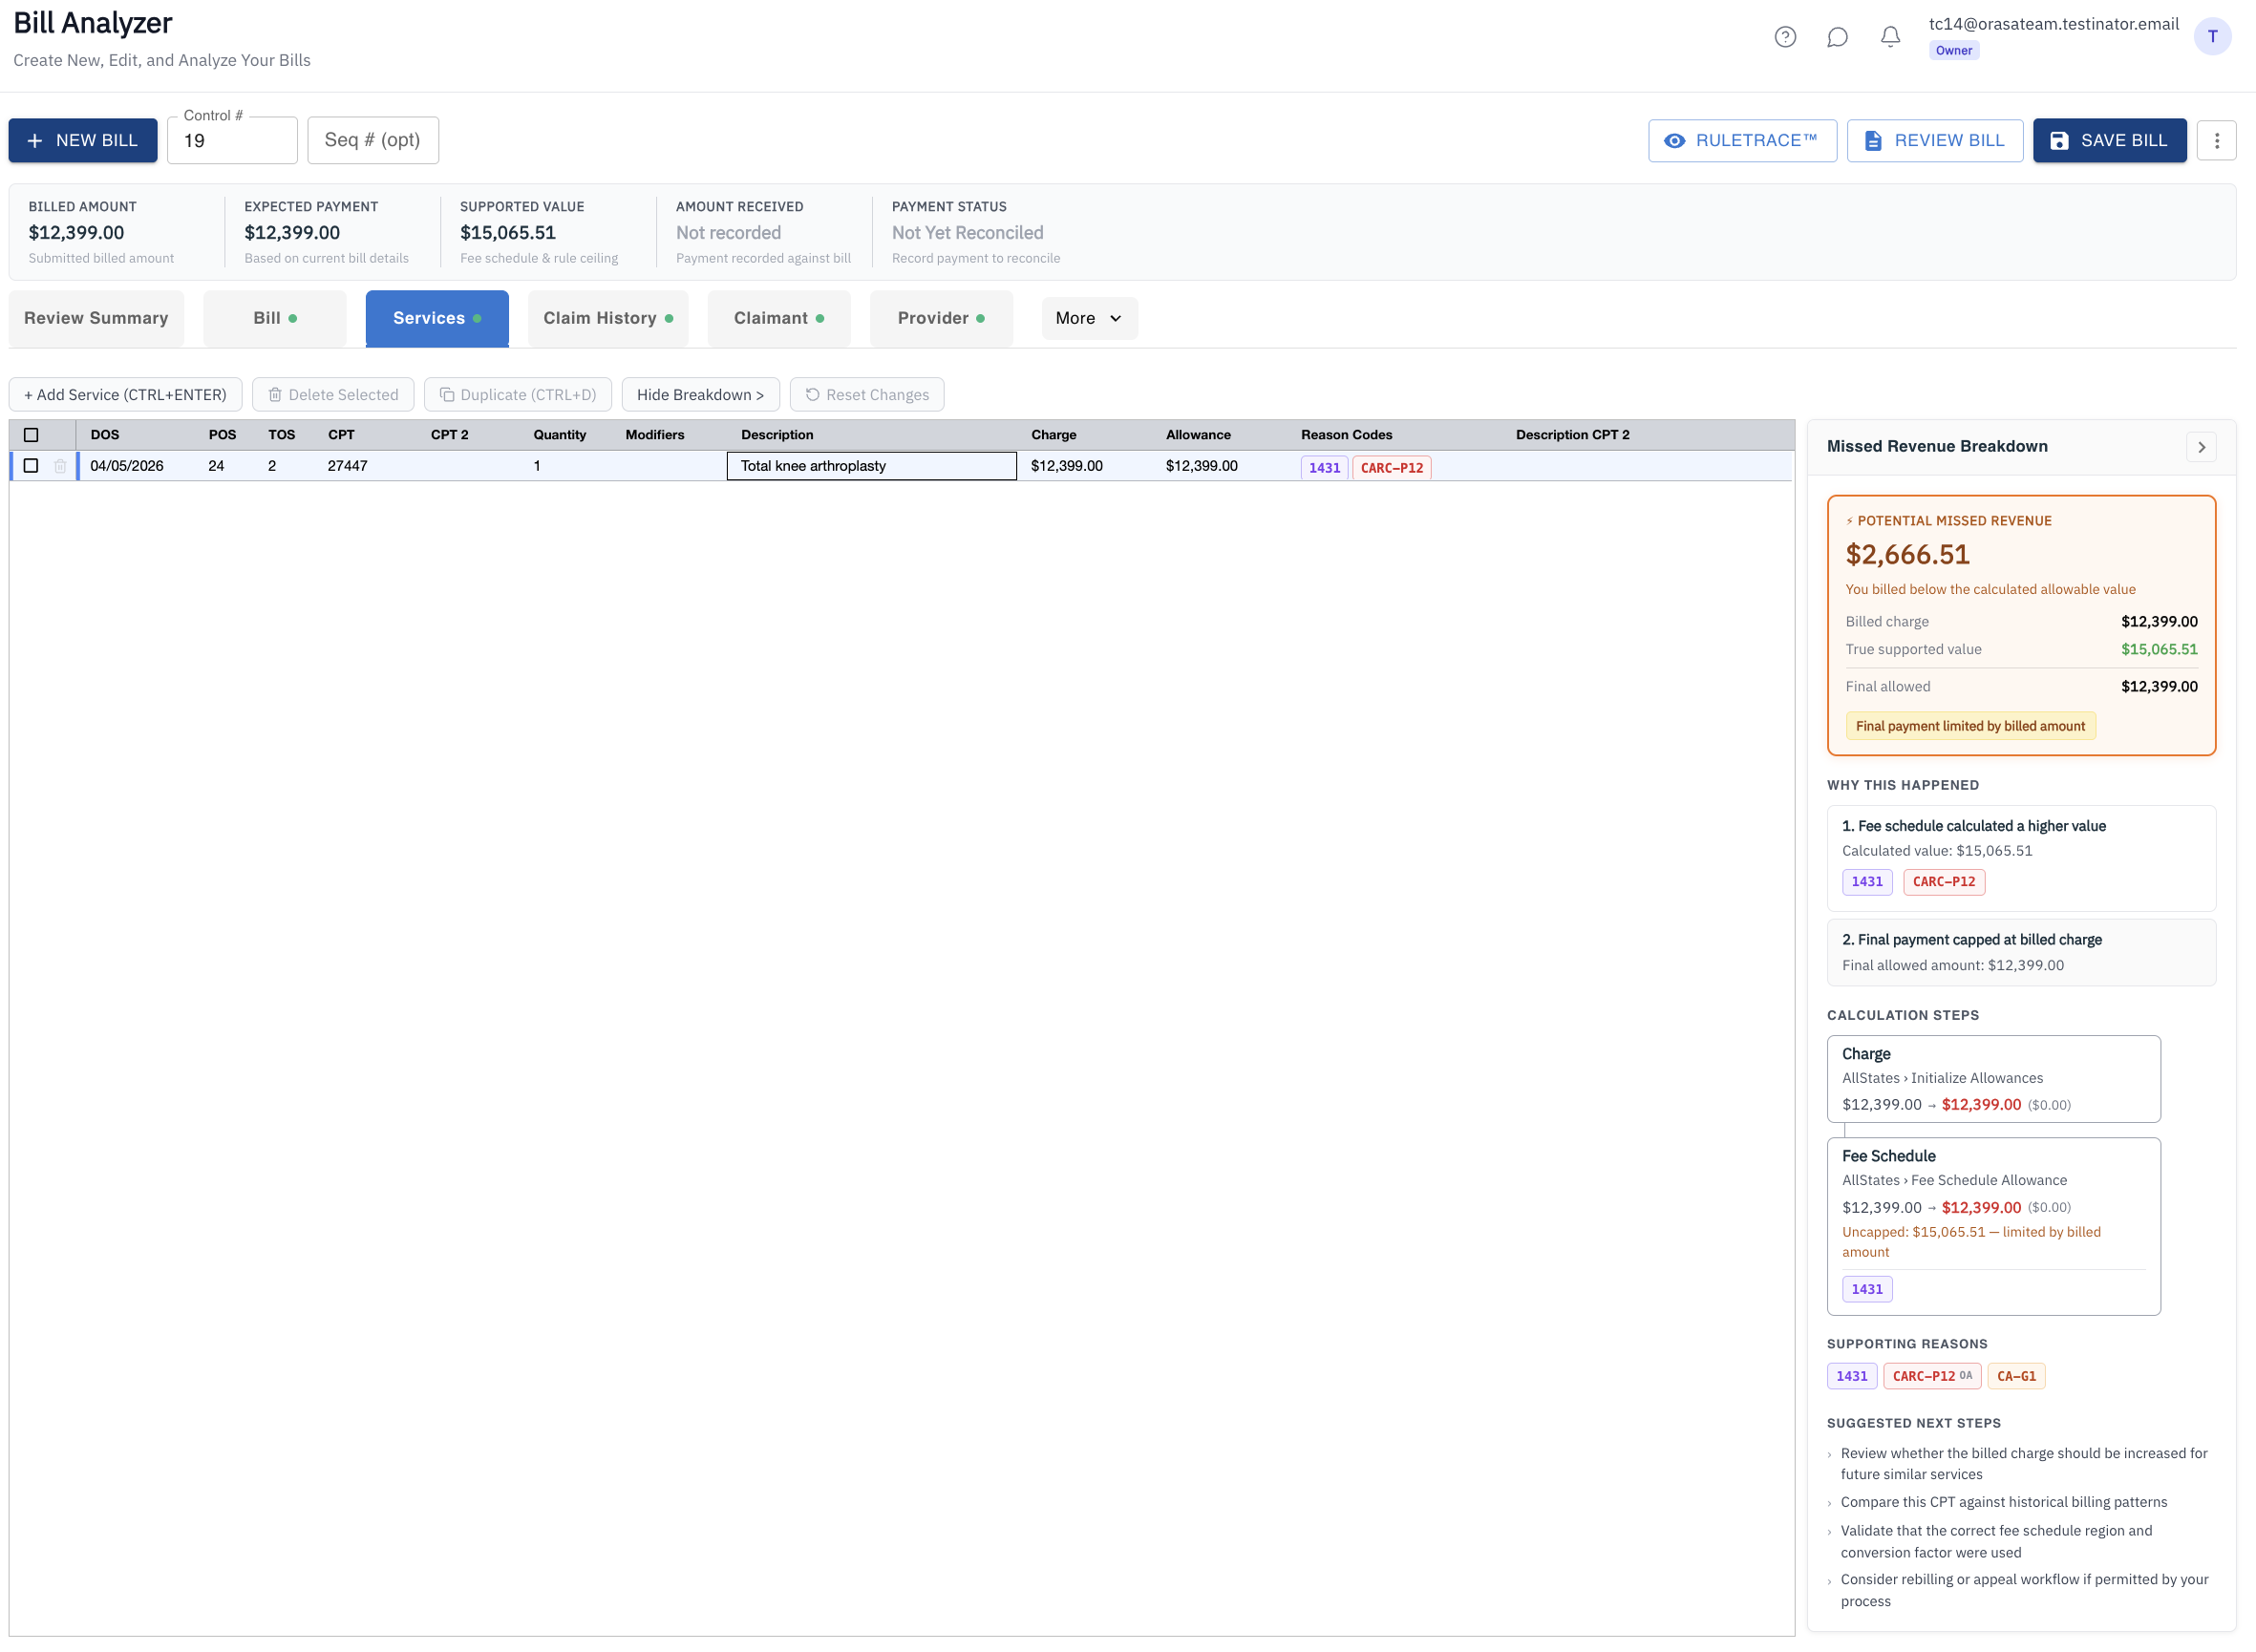
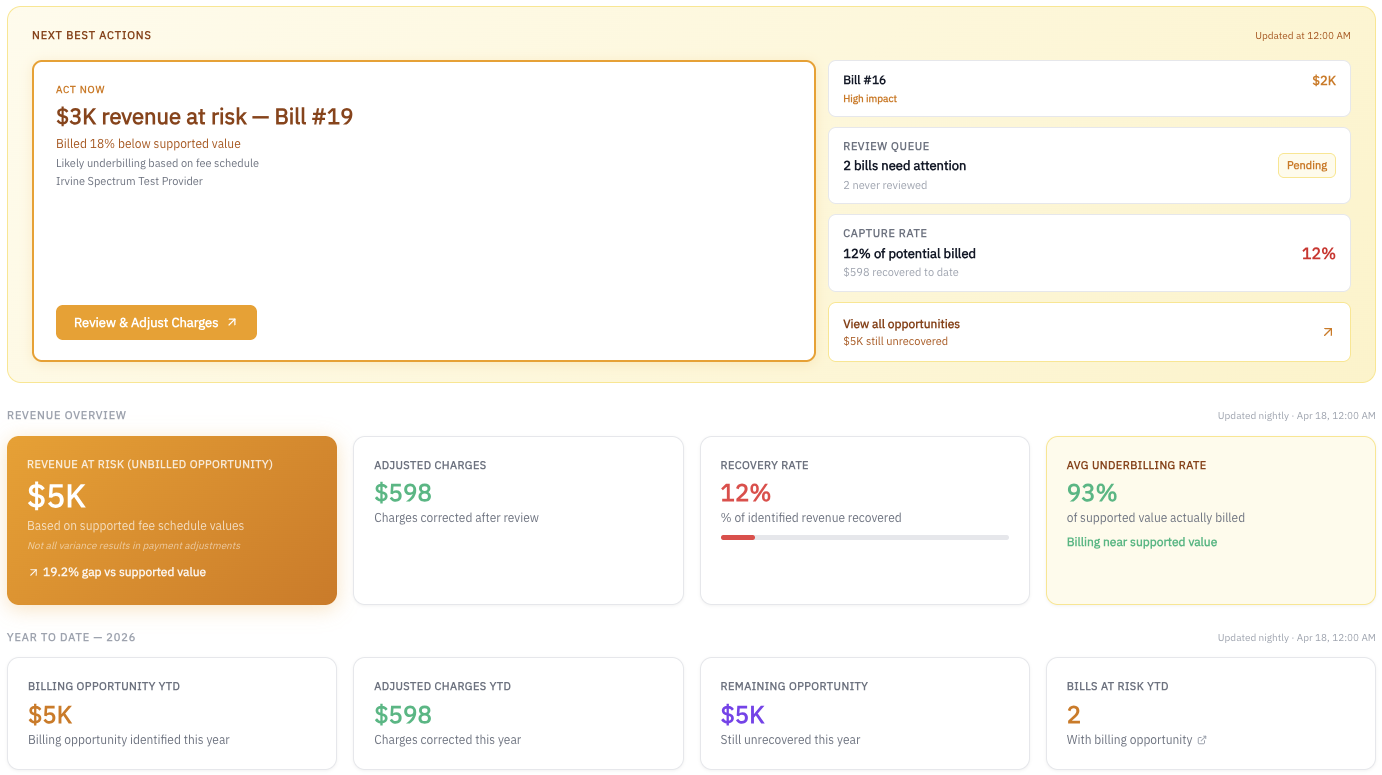
The revenue dashboard highlights bills where your charges fall below the supported fee schedule value, ranked by opportunity size.

💡 $3K revenue at risk identified on a single bill
Provider dashboard showing bills ranked by missed revenue opportunity
⊕ Click to expand
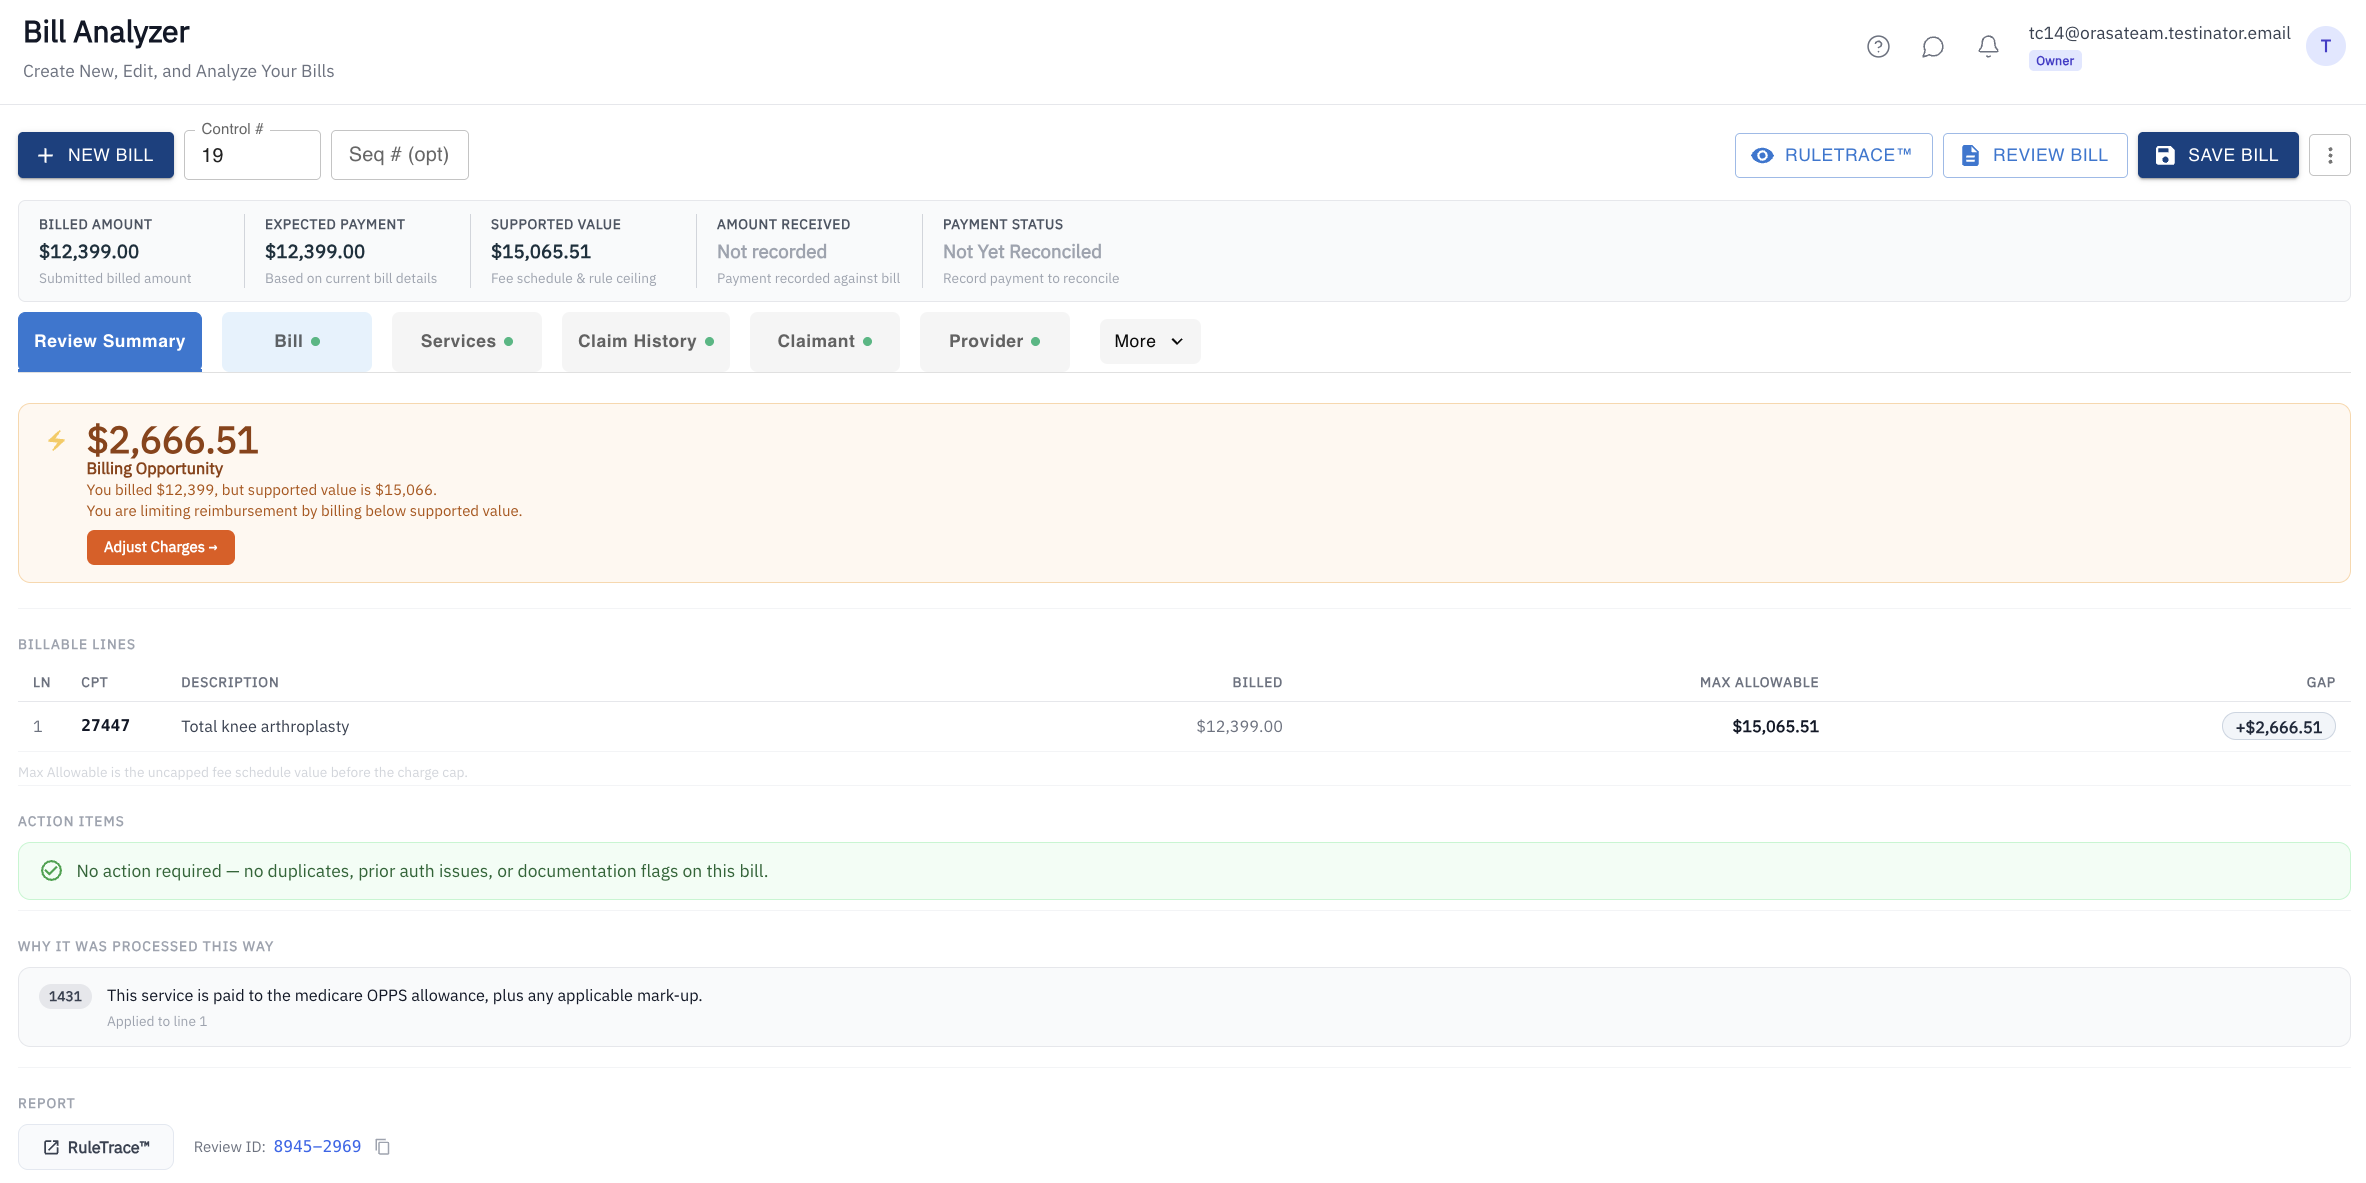
Once a gap is identified, you can immediately see how much revenue is being missed.
Provider Review Summary showing billed vs fee-schedule-supported value and revenue gap
⊕ Click to expand
2 QUANTIFY MISSED REVENUE

Compare billed charges to supported values and uncover missed revenue

The Review Summary shows your billed amount, the fee schedule-supported value, and the exact gap, so your team knows exactly what to fix.

💡 Billed $12,399 → Supported $15,065 → $2,666 missed
From there, drill into each line to see why, and what to change.
3 FIX IT BEFORE SUBMISSION

See why payment was capped, then adjust before the bill goes out

RuleTrace™ shows why the fee schedule supports a higher value and what is limiting payment. Raise the charge on each line before submission.

💡 Capped at billed amount. Raise the charge to $15,065 before submission
Provider line detail showing missed revenue breakdown and full calculation explanation
⊕ Click to expand

Share the RuleTrace™ with your billing or revenue team before the bill goes out.

See a live RuleTrace™ →

Manage billing for multiple providers?

BillSentry helps RCM and medical billing teams validate workers’ comp reimbursement, identify missed revenue, and prioritize recovery opportunities across their provider clients.

Explore BillSentry for RCM →

Run your first bill in minutes

Start Free Trial